A Costly System of Outdated Beliefs
By James P. McGinnis, Managing Director, Renewable Energy

An Existential Challenge – and a Monumental Investment Opportunity. As world leaders and scientists gathered in Katowice, Poland this month for yet another round of UN-sanctioned global climate talks, it is becoming clear that society has (finally) reached an historic inflection point, moving from threat assessment to a global shift in patterns of energy use. The past few years (and months) have brought a threatening storm of clear, repeated signals from Planet Earth and even the deeply divided U.S. Government1 has now added to what the global scientific community has been sharing for years: clear evidence that the threat of global warming is real, is growing and its impact is being felt today. In an unprecedented display of global collective response, a growing majority (but certainly not all) of humanity is now focusing intellectual energy, technological research and large new capital commitments into a fundamental shift in how our society captures, stores and consumes energy. We are fortunate in that many encouraging technological and manufacturing breakthroughs have dramatically changed the economics of decarbonization, making clean energy economically more attractive than burning hydrocarbons.
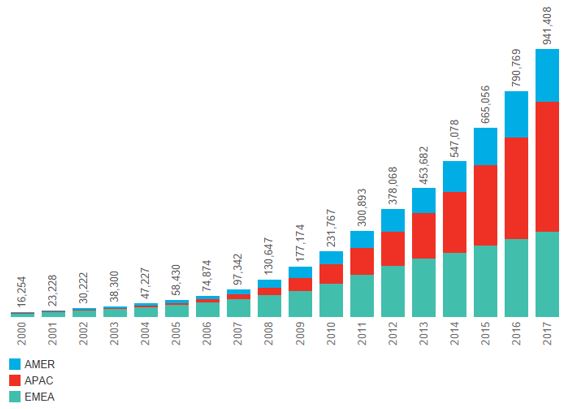
An Impressive Pace of Renewable Expansion… Financing the shift from carbon-intensive energy sources to renewable energy presents unprecedented opportunities and challenges, almost matched by the impressive size of capital pools now available to pursue them. Last year, $277 billion was invested in new renewable energy projects across the globe, adding 151 GWs of wind and solar power and bringing the world’s cumulative total to 941 GWs2, nearly equivalent to total installed US generation capacity at year end 20173. In contrast, the net additions of conventional, fossil-fired generating capacity worldwide were less than half that amount last year, at 72 GWs4, consistent with a shrinking trend the prior three years.
Cumulative Global Installed Renewable Power Generation Capacity (MW)5
…With a Very Long Way to Go. In the last ten years, an impressive $2.3 trillion has been deployed in this sector6, on assets which have an average expected energy production lifespan of over thirty years with zero fuel costs and insignificant “decommissioning expense”. That’s a solid running start for what is essentially a start-up industry, one doing direct battle with politically powerful, financially strong incumbents.
In isolation, this investment opportunity and capital pool seems large. Yet in context, the size is trifling compared to what the global economy is annually spending to identify, extract, refine, transport, store, combust, convert, cool, scrub, decommission and remediate vast but finite supplies of what is essentially ancient solar power stored beneath the Earth’s surface as hydrocarbons. As we have for decades, we also annually plow another fortune into the construction and maintenance of highly specialized equipment to enable these processes. Despite an established scientific consensus and an emergent, still tentative political agreement on the existential risk and cost of even greater CO2 emissions, our massive habitual spending on global hydrocarbon consumption is still growing. As the chart below indicates, renewable electric power generation, which despite the above-cited strong growth in installed capacity from wind and solar, has a very long way to go to make a meaningful dent in our fossil fuel consumption for power generation.
Power Generation (GWh) by Source, Globally7

Comparison to Fossil Fuel Spending.
To put last year’s $273 billion investment figure in renewable power into context, the total value of raw hydrocarbon production/consumption (in a largely balanced system) across the global economy was, at approximately $2.97 trillion, more than ten times this investment. The 2017 breakdown: $1.9 trillion on oil, $677 billion on natural gas and $394 billion on coal8.
The Add-On Costs. This roughly $3 trillion spent last year globally on the finding, extraction and sequestering of existing hydrocarbon molecules for purchase in raw form, of course, excludes the massive additional costs of refining, transporting and storing of the commodities, as well as the capital spending on plants which consume and/or convert such hydrocarbons. What are those additional outflows? The answer, like much across the energy sector: it’s huge, it’s complex, it varies through time, and it depends on the interplay of a massive ecosystem of adjacent industrial sectors, such as tanker and dry bulk shipping, railroads, trucking, petrochemical refining, pipeline operations, gas liquefaction and regasification and conventional steam power generation.
Crude Oil. Once produced at the wellhead, oil and associated gas and liquids need to be gathered, and piped via a network of crude oil pipelines, trucks, tankers and railcars to refinery gates. The refining of oil alone is an immense undertaking. Using average global refining “crack spreads” of $.30 per gallon or $12.60 per barrel in the last twelve months, refining the 35.9 billion barrels of oil extracted in the latest twelve months cost (by raising the value of the hydrocarbon products ultimately consumed) another $452 billion9. To be sure, petrochemical refineries produce other saleable outputs such as plastics, detergents, lubricants with 10-12% of each barrel of crude, so in assessing costs, let’s conclude (generously, ignoring the unique damage/remediation costs of those other products) that the net addition to annual global hydrocarbon costs from refining is conservatively $400 billion. If we add the cost to transport and store crude and petroleum products via dedicated pipelines, ships, ports, and tank farms and then distribute the end products, we estimate the annual “midstream” and “downstream” costs of producing, handling and consuming the crude oil product suite alone climb to nearly $2.8 trillion.
Thermal Coal. During 2017, global thermal coal consumption rebounded slightly (up 1.0%) reversing a three-year downward trend, to a total of 3.73 billion “barrels of oil equivalent” or 5.8 billion US tons10. For reference, at a relationship of 2.86 tons of CO2 emitted per “short ton” (2,000 lbs.) of coal at standard heating values, last year CO2 emissions directly from coal combustion was 16.5 billion tons (aka 16.5 gigatons). At an average selling price in 2017 of about $68 per ton, the value of 5.8 billion tons of coal extracted, transported, sold and burned last year was $394 billion11, including freight costs, which alone amount to approximately 41% of delivered selling price12.
Natural Gas. The sale of pipeline-quality natural gas at hubs around the world, as shown above was estimated to be $677 billion; the further transport by pipeline, and also via liquefaction and shipping followed by regasification of the commodity for transoceanic consumption (LNG now accounts for 9.8% of global gas supply, and that share is growing) will have cost another $70 billion, based on a very rough estimate of 10% of wellhead cost gross-up13.
Costs to Convert to Energy. To quantify our best estimates of annual net cash costs on hydrocarbon conversion to mechanical energy, then to electric energy, the table below details an estimate of $160 billion annually in O&M costs alone, shown by global fuel types. This rough analysis starts with Bloomberg New Energy Finance (BNEF) estimates of total power generated by fuel type, and then assumes US-fleet efficiency worldwide. In reality, much of the global generation fleet is likely to be (if measured) considerably less efficient, with lower labor costs and fewer environmental costs than these estimates, but the exigent costs of lower standards in, say, developing economies (e.g., greater airborne emissions, unmonitored cooling water effluent controls, worker injuries/fatalities, for example) should be considered “costs” as well, and so, as a hypothetical, we use this standard US measure to provide a global estimate:
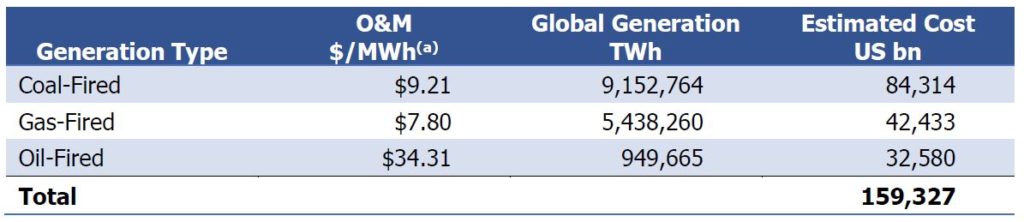
Source: BNEF; FFERC Form 1, “Annual Report of Major Electric Utilities, Licensees and Others via SNL Financial.
(1)Based on the aggregated 2017 O&M expenses (excluding fuel) of approx. 1,990 operating power plants in the US.
As the topic of further research, we will explore in greater detail how added costs from seaborne shipping of oil, petroleum products and LNG are best estimated, as well as the costs of shipping via pipeline, the cost of gas fractionation, and the operating costs of oil, gas and product terminals and storage. Taken together, our conservative estimates bring our entire hydrocarbon production, refining, shipping and consumption cost, annually, to at least $4 trillion.
These are the financial costs. What are the environmental costs? Through this roughly $4 trillion process of finding, transforming, transporting and converting hydrocarbons, global carbon emissions reached a record level of 32.5 billion tons last year, after three years of being flat14.
Is It Even Enough? During the last decade of increasing investments in renewable energy, BNEF estimates that 1.8 billion tons of CO2 emissions have been avoided; that’s just 5.5% of what was emitted last year alone, and 0.55% if forecast – flat – over the next decade!
One question that should be considered carefully – by policy makers, corporate executives, and investors – is: supposing $300 to $500 billion of new capital is deployed annually in building wind and solar projects each year for the next two decades, how does that amount stack up to scientific consensus global CO2 emission reduction targets? Unfortunately, it’s not enough: BNEF has projected that to meet the Paris Accord commitment of limiting the increase in the Earth’s temperature to just two degrees Celsius by 2040, will require another $14.0 trillion – $700 billion/year to be invested by then. That’s nearly three times our current pace of spending on renewables.
I submit that investing $700 billion per year is actually quite reasonable in the context of i) specifically eliminating a majority of coal-fired generation, by far the dirtiest and least efficient hydrocarbon conversion activity and the associated transport and clean-up costs, and ii) reducing a significant portion of our $3 trillion annual crude oil consumption habit with its associated costs by shifting a large proportion of our global transport sector to electrified mobility.
A System of Outdated Beliefs – the OBs. Whether or not BNEF’s 20-year renewable investment target of $14 trillion, or even some radically smaller amount, can be deployed to fund the transition from fossil-fuel dependency to a decarbonized global economy won’t likely be limited by low expected financial returns; today’s modest risk/modest return framework is frankly acceptable to a wide population of investors. Rather, the key barrier to be overcome is that there are certain outdated, and now even untrue beliefs about renewables which many veteran industry professionals have espoused, held and continue to hold. An obvious tautology endures – you can’t control when the sun shines or when the wind blows – but these road blocks are now minor speed bumps, largely overcome by the advent of cost-effective energy storage solutions, sharply lowered generation and balance-of-system costs, better integration of wind plus solar, and improved grid management through technology.
Today our historical beliefs, even as they are overcome, directly affect our assessment of risk and thus, how we select and finance projects. While exceptions abound, even seasoned energy and finance professionals, regulators and politicians can seem ideologically tethered to one or more (or all) of five seriously Outdated Beliefs regarding the projects and risks attendant (let’s call these the “OB’s”):
- (1) That renewable energy requires heavy economic subsidies, always and everywhere, to deliver competitive returns because fossil-fueled generation alternatives are simply cheaper;
- (2) That due to uncontrollable intermittency, power from wind and solar are inherently unreliable, which renders these sporadic generation sources too complicated and costly to convert (without heavy subsidies) to stable sources;
- (3) That electricity must be consumed as it is produced, and wind and solar projects often produce power at times inconsistent with peak demand requirements, and further, electricity storage is prohibitively costly.
- (4) That demand for power varies uncontrollably, moved by weather and other exogenous factors; and
- (5) That renewable energy is mostly generated in locations physically remote from demand centers, and thus injects an excess of grid instability and higher transmission costs.
Breaking News: The Industry Is Examining, Mitigating and Debunking Each of These Outdated Beliefs, and Rapidly. In the intense race to capture the new “Prize” of dominating the provision of clean energy, each of these five OB’s are giving way to a new reality which is reshaping the relevant, near-term future that investors and corporate players consider as they make new investments in the renewable sector. That story follows, taken one “OB” at a time:
OB#1: By far the most important update to an Outdated Belief is that heavy economic subsidies are no longer needed to mitigate high costs; increasingly, without these subsidies renewable projects can compete effectively on price alone, and in a greater number of locations. Government subsidies in the form of Investment Tax Credits, Production Tax Credits and Renewable Portfolio Standards have forever been a critical economic stimulus for the renewable industry. Of course, as economically rational actors, renewable developers will continue seek subsidies where they are available, and advocate to forestall “sunset” periods. The reality is these economic incentives are only necessary today in certain places, and under certain conditions. In many regions, across different market conditions, renewables are highly competitive – and attractive – on a standalone economic basis.
How do the actual costs compare today, all things considered? To get an apples-to-apples comparison, we must consider two capital intensive facilities: on one hand, a hydrocarbon-burning, dispatchable power generator with a lifetime of heavy fixed and widely variable operating costs; and on the other hand, an intermittent generator with large upfront capital costs but a lifetime of zero fuel consumption and minimal operating costs. These two very different cash flow models require the use of a customized common metric for comparison. That best metric is the levelized cost of energy (LCOE), calculated over the lifetime of a new-build fossil plant, wind farm or solar project. The US Energy Information Agency publishes an annual report, which uses LCOE to compare across generation technologies, and reflects the impact on generation costs of specific US tax laws and emissions standards, as these are today and scheduled through time. Bloomberg New Energy Finance independently publishes similar reports (Wind LCOE and Solar LCOE) with slightly different assumptions (largely on the decommissioning costs of coal, nuclear and gas plants), as does Lazard Ltd., annually, the latter quantifying the difference between subsidized and unsubsidized generation costs. The reports all found a closely competitive result as between fossil-fired and renewable power costs. The results:

All three research sources indicate that today, the costs of generation from renewable power in the US are very competitive with, and in some cases, better than fossil-fired costs. Indeed, Lazard’s November 8, 2018 statement accompanying the release of its new LCOE Report highlighted that “we have reached an inflection point where, in some cases, it is more cost effective to build and operate new alternative energy projects than to maintain existing conventional generation plants.”
Are Theoretical Costs Relevant to Actual Decisions? While a broad national comparison of costs is an interesting measure of the economic potential of renewable power, candidly, it is simply irrelevant when it comes to localized decisions. The choice of technology for power generation on a state-by-state or regional hub basis must always be economically justified against an array of unique, local cost considerations and power consumption patterns. Gas-fired, nuclear, and coal-fired generation stations each have construction and ongoing fuel costs which vary in meaningful ways across the country. Such costs are a product of local fuel abundancies, and transport and storage costs, as well as emissions limits and remediation costs; taken together, these nuances, modified by widely varying degrees of regulatory scrutiny, have largely driven historic regional fuel mix. Similarly, the economics of wind and solar generation are overwhelming driven by location – or more specifically the climate conditions of the site. In short, what works best in Arizona, Alabama, New York, and Texas are quite radically different; that set of differences will map the future of energy production in the U.S.
Location, Location, Location. So, in which markets are wind or solar power the least-cost alternative, and under what conditions? What sites are available for development in those markets? What do we need to assume at each site about the future economics of solar, wind and conventional (largely gas-fired) technologies, delivered fuel prices, transmission costs/access and emissions externalities for this adjusted “merit curve” to be valid in the future? An excellent grounds-up analytic model developed at the University of Texas at Austin’s Energy Institute takes observed LCOEs for all resources, and, based on plant efficiency assumptions, fuel commodity and transport costs, draws analytical conclusions for the identity of the Lowest Cost Alternative, not just by region, market hub, or state, but by US county.
Lowest LCOE Energy Source by U.S. County

Source: The University of Texas at Austin Energy Institute
The UT Energy Institute map highlights that natural gas, at today’s prices (levelized for current market price forecasts) is still a dominant economic provider of electric generation in certain US regions, with wind a strong second, and solar making headway regionally. This comparison is notable in that it excludes US Federal economic subsidies for wind and solar in drawing renewable power cost comparisons. What’s also notable is that coal is completely absent, as is nuclear power.
How Things Have Changed. Not surprisingly, as little as twenty years ago, this US map would have looked quite different and simple: almost an equal split between orange (gas-fired generation) and black (coal-fired generation) as the LCOE. In 1998, Central Appalachian bituminous coal (that benchmark form of coal most widely used for electric generation) sold for an average of $24.87/ton (or an inflation-adjusted $38.58/ton today); for the full year 2017, the price for bituminous coal averaged $55.84/ton, roughly 45% higher, on a real basis, than in 199815. The selling prices sharply understates the cost difference of EPA-imposed coal pollutant standards; UT-Austin experts estimate the cost of “scrubbing” coal-fired power plants has added 30% to power costs on a levelized basis. Taken together with higher fuel costs, new coal generation has nearly doubled in cost in the last twenty years.
Natural gas had an average price of $2.16/mmcf in 1998 (or an inflation-adjusted $3.35/mmcf today) at the most liquid US trading point, Louisiana’s Henry Hub. Having been through an exceptionally volatile period of shifting supply costs driven by the US shale revolution in production techniques, gas prices had settled into a several-year period of dampened volatility and abundance – and is now spiking past $4/mmcf. Concurrently, far fewer new gas combined cycle plants have been built in the US, in turn resulting in far fewer efficiency gains (versus steep declines in previous decades as ever-improving combined-cycle gas generation replaced simple-cycle turbines). Also, despite abundant supply and sharply improved drilling technologies, natural gas spot prices averaged $2.99/mmcf in 2017, on average 38% higher than in 199816, just as generation efficiencies have stalled.
The Slide in Renewable Costs. Unlike the recent, perhaps inevitable return to volatile hydrocarbon prices, the cost of producing power from wind and solar generation projects have been in a relentless, steady decline. As compared to today, new generation projects in 1998 produced electricity at a levelized (LCOE) cost which was at least 300% higher, with lower capacity factors (improved siting, tilting solar panels and higher turbine hub heights have all helped), significantly higher panel and turbine costs and sharply lower manufacturing volumes. In fact, 20 years ago (much less 30 or 40 years ago), there was no immediate economic rationale in any US county or state to build wind or solar, without government-imposed subsidies and regulatory requirements. That math has changed, for many reasons (to be explored in coming pieces) and it will continue to change, as will this LCOE map, especially as storage costs continue to drop, moving inexorably toward economically attractive renewable generation. At some day in the very near future, the need for subsidies will… subside.
OB#2: Fears of uncontrollable intermittency are well-deserved, rational and… obvious. Solar is only available during the day, and of course can be sharply curtailed on overcast days. Wind is variable, too: capacity factors on an excellent wind project are typically no more than 30-40%, and they fluctuate by the hour, day and season. In certain US regions, the wind tends to blow mainly at the lowest demand hours – at nighttime (note: this is useful for peak home lighting load in rural emerging markets, but not as much for urban/suburban peak air-conditioning load).
Combining Wind and Solar Helps. That said, there are often huge synergies with offsetting time-of-day peak capacity factors for wind versus solar, so that the combination of wind plus solar in a generation portfolio very sharply reduces gaps in generation, as many time-of-day differences in generation are highly complementary. Further, the zero-marginal cost of wind and solar, hedged with only modestly higher cost fossil-fuel generation during downtimes, can combine for a massive total cost reduction to consumers in developed markets on a 24/7/365 basis (as we have seen in dramatic fashion, for example, in the Chilean market from 2014 to today).
Batteries, Hedging and Demand Response All Help, Too. Aside from wind/solar complementarity and incumbent fossil-fired hedging, the emergence of low-cost battery storage solutions also sharply mitigate this issue as well (see below). Of course, as with costs above, this intermittency and the availability of intra-renewable (i.e., solar + wind) operations as well as the availability of cheap, incumbent fossil-fueled hedging varies widely by region and country. With hedging tools and synergistically combined operations, wherever intermittency remains an issue, it is rarely a show-stopper.
OB#3: Electricity must be consumed as it is produced… with economic storage, now is simply no longer the case. With remarkable technological advances in energy storage from batteries and sharp reductions in its cost, and with much more to come, both utility-scale and household-scale storage now are cost-effective sources of reliable back up power and grid balancing mechanisms to defeat challenges which arise from intermittency. Utility-scale storage investments using pumped hydro, compressed air storage, and now large lithium-ion battery units create an array of storage alternatives for power consumers and their distribution service providers. The question now becomes: What is the least-cost method of aligning time-of-day generation and consumption patterns?
Fast and Cheap. New, cheaper manufacturing and rapid installation methods in utility-scale power storage have widely set the stage for grid stabilization mechanisms which pay for themselves through the use of cheap off-hours excess power generated by renewables. In the summer of 2017, Elon Musk famously wagered (in a text!) that within 100 days Tesla would be able to build a 129 MWh battery storage facility adjacent to a wind farm, located 120 kms north of Adelaide, South Australia, villainized for allegedly causing the instability of the State’s grid, or Tesla would deliver it free; Musk won the bet, delivering an operational facility – with 40 days to spare.
Competitive with Replacement Power. Another example of competitively priced energy storage is the proposed building of 382 MWs of grid-stabilizing electric battery units near Monterrey, CA awarded by the California Public Utilities Commission and PG&E to two sponsors: Tesla, and battery newcomer Vistra Energy, a Texas-based unregulated power producer (not surprisingly, Vistra is the owner of one the nation’s largest fleets of coal-fired power today, and of course, Vistra’s leadership team has gained an appreciation for the value of storage in the wind-intensive West Texas market). These proposed northern California facilities met the standard of competing on a “heads-up” cost basis with existing gas-fired plant alternatives nearby proposed by incumbent generator Calpine, who had requested a designation of “must-run” status from the CPUC to qualify for differentiated plant revenues in return for providing grid stability. Incidentally, the two winning battery proposals were the best of what PG&E says were “two dozen proposals with more than 100 variations” in response to its Request for Proposals17.
Combining Storage and Generation. These South Australia and northern California storage victories aren’t the only advances being made in utility-scale energy storage. Many large-scale renewable companies now evaluate new generation and storage projects on a combined basis, with imbedded intermittency costs thus removed. In its second quarter earnings call on Jul 25, 2018, the CFO of the largest US renewable owner-developer, NextEra Energy Inc., John Ketchum, answered an analyst’s question asking him to quantify projected storage costs: “…you can think of it as roughly $0.015 a kilowatt hour [i.e., $15/MWh for consistency with cost comparisons above]. That is probably going to move, with what we see with the significant investment being made in electric vehicles and the cost declines that we expect to see on the solar side. Early in the next decade, mid-next decade, it’s going to probably be about a $0.005 per kilowatt hour add… and so if we find ourselves in a marketplace where we are selling wind right around $0.02, a combined wind and solar product probably looks roughly around $0.025. Solar, into the next decade, probably looks more like a $0.03 product, sub-$0.03 in some markets. You add half a penny on that on the high end, you’re probably at about $ 0.035 a kilowatt hour.” (Compare this to Figure 4; Ketchum’s example would represent the US’ lowest cost alternative generation source, wherever it could be installed.)
OB#4, that demand for power is unpredictable is also true, but in recent years, a few underlying things have begun to radically change this dynamic, from both the supply and demand sides.
Smart Meters. the deployment of advanced metering infrastructure (AMI) among US utilities, also known as “smart meters”. While ten years ago (2009), less than 10 million smart meters were in customer homes, to date over 80 million such meters have been deployed. These meters send customers real-time price signals detailing power use, and have had an increasing impact on electricity consumption.
Demand-Side Management programs now employed in a majority of US states not only give customers a real-time price signal, but explicitly compensate certain classes of customers, largely industrial and commercial customers for voluntary reduction of load.
Hedging Tools Are Abundant. As referenced above, the existence of capacity markets in some regions enables efficient hedging to handle unusual surges (eg, heatwaves); a price signal on capacity makes demand unpredictability easier to manage for both generators and electricity retailers.
Conventional Power as Back Up Power. By definition, power market hedges are sourced from the most willing/cheapest providers among incumbent generators; the greater the growth in renewables, the greater the availability (and thus, economic attractiveness) of such hedges as energy market share from incumbents declines and idle capacity increases.
OB#5, that renewable generation creates an excess of grid instability, is (i) mitigated by the trend of rapid deployment of rooftop residential and commercial solar panels which are actually co-located with demand and, (ii) where remote and intermittent generation (eg, offshore wind) does play a large role, it is simply not an unusual problem in most of the developed world’s grid infrastructure.
Co-Location of Generation and Consumption Becomes Viable. One of the fastest growing (though still relatively small) renewable power market segments is rooftop residential solar. This product reduces grid congestion because it co-locates generated power with customers, and, particularly for daytime air-conditioning load in the South, largely matches time-of-day consumption with heaviest use. According to Vivint Solar (one of the top 3 providers in the US), rooftop solar has grown 37% annually since 2010 through year-end 2017, with annual additions jumping tenfold during that period, and reaching over 7 GWs in the last three years alone. With rapidly declining panel and installation costs, improved product sales, marketing and distribution by companies like Vivint, Sunnova and Sunrun, and the rapid advance of residential-scale battery storage (eg, Tesla’s “Powerwall”, which can easily fit on a garage wall), home solar generation and battery use is poised to accelerate in growth.
Grids Already Manage Intermittency and Remoteness. For utility-scale solar and wind, the power grids serving most major metropolitan areas have been designed over many decades to draw power from a handful of very large baseload generating stations (especially coal and nuclear) outside of the city. In response to changing supply sources (and distributed generation) most urban US utilities (e.g., Con Ed in NY, Eversource in Boston, PG&E in San Francisco, Xcel Energy in Denver and Minneapolis, and Exelon in Chicago, Philadelphia, Baltimore, and the District of Columbia, etc.) are well underway in designing and installing the next generation of rate-based transmission and distribution systems, which will integrate these resources efficiently. Metropolitan area grid enhancements are neither cheap nor easy in densely populated urban/suburban environments, but because they rely on the improvement of existing lines and transformer stations (“brownfield” vs. “greenfield”), there is less cost involved than an entire new build requirement. One example: there are many soon-to-be decommissioned nuclear plants which sit in remote, sparsely populated corners of the grid along the US Mid-Atlantic coast. The same infrastructure can be repurposed to draw power from very large, new offshore wind farms. What better way to utilize these in situ highways for power that already exist than importing offshore wind power?
Willing Partners. Most US utilities are more than ready to take the lead in this endeavor. As Anne Pramaggiore (CEO of Exelon Utilities) said in a Nov. 30, 2018 forum on electricity policy hosted by the Washington Post:
“I believe that we have to start thinking about the electric utility industry as being indispensable for delivering the climate change solutions. We heard a lot this morning about the impacts of climate change, the complexity and the vexing nature of that problem. And when I think about the solution sets, they don’t look like a linear equation to me; they look more like a scatterplot in need of an organizing function. And I think the organizing force is going to be policy, but I think the electric utility industry can be the connective tissue that brings that together.
And when we think about the grid as a physical asset—28% of greenhouse emissions come out of the power industry, another 28% are attributable to the transportation sector. If you convert the grid to a clean-power grid and you convert the transportation sector to electric, you go a long way to solving much of the greenhouse gas emission problems.”
Moving Past Outdated Beliefs. So, will the issues of building and financing renewable power projects just take care of themselves? If these Outdated Beliefs are cast aside in favor of recognizing a New Post-Carbon Reality, can we reconfigure investments globally? Can we consciously alter our collective consumption behavior, and adjust our decision framework and investments to accept a new belief system? Or should industrialized society continue to amble ahead with our massive sunk costs on hydrocarbon production and consumption and our deeply imbedded and outdated capital allocation framework, and wait for some Invisible Hand to usher in the new era of clean, emission-free or low-emission power?
Maybe. Will it happen soon enough?
That’s a business, investment and frankly, a moral question that deserves our attention.
Footnotes
- National Climate Assessment.
- Bloomberg New Energy Finance.
- U.S. Energy Information Administration Annual Statistical Review, 2017.
- Bloomberg New Energy Finance.
- Ibid.
- Ibid.
- Ibid.
- 2017 BP Statistical Review of World Energy: June 2018.
- U.S. Energy Information Administration Annual Statistical Review, 2017.
- Ibid.
- Ibid.
- U.S. Energy Information Administration.
- International Gas Union 2018 World LNG Report.
- International Energy Agency, Global Energy and CO2 Status Report, 2017.
- U.S. Energy Information Administration.
- Ibid.
- IEEE Spectrum.


